Computational Design - 2025
Sun Between Towers
- Client
- UC Berkeley - Arch 249, Computational Design
- Role
- Computational Designer
- Year
- 2025
- Timeline
- Final Project
- Type
- Parametric Urban Daylight Study
- Approach
- Parametric generator → annual sun sim → 60-iteration sweep
Tools - Rhino + Grasshopper + Ladybug Tools + Python (pandas / matplotlib)
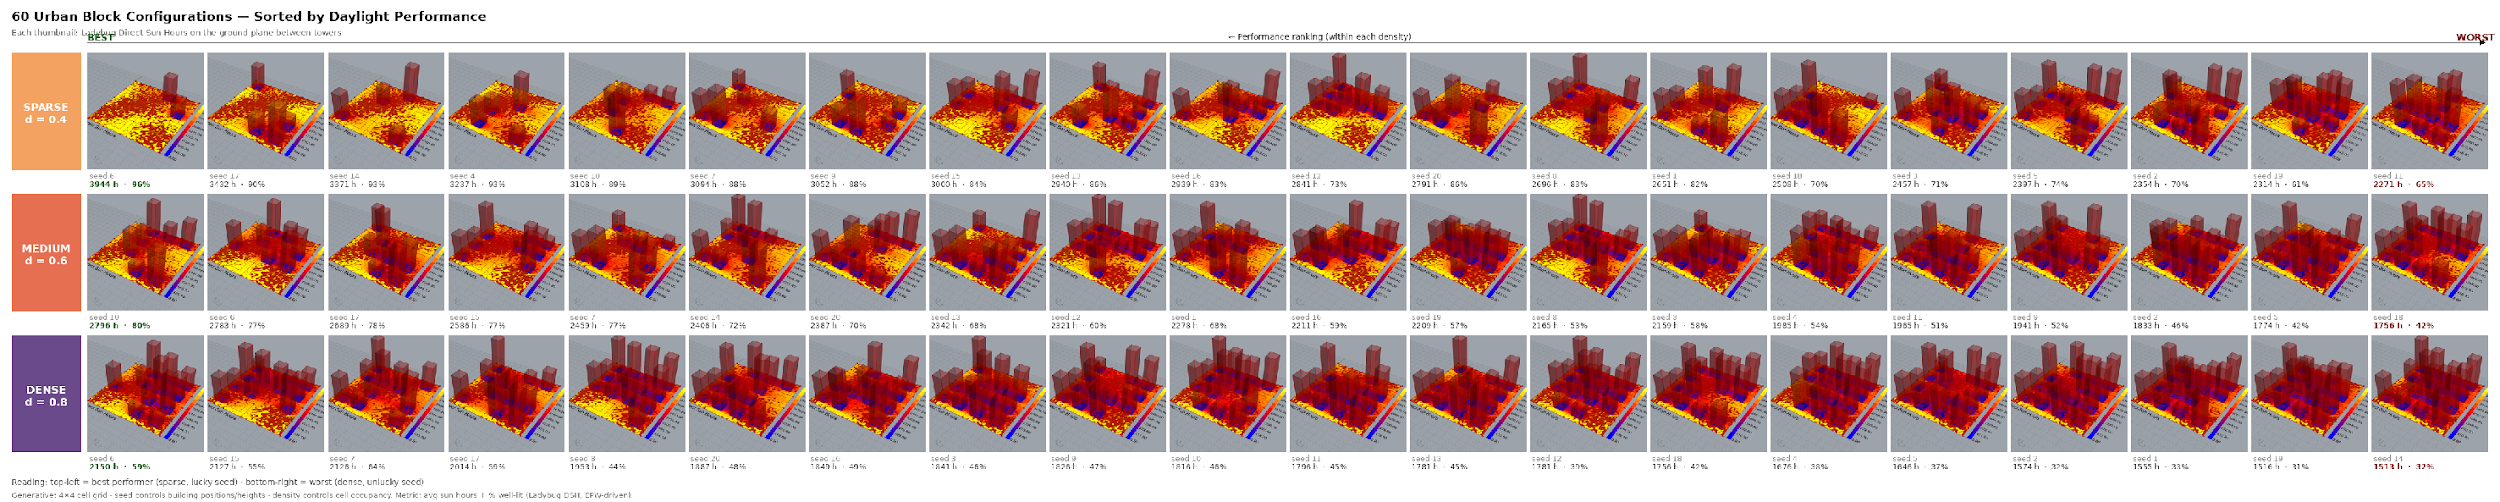
A parametric study of how urban density shapes ground-plane daylight - 60 tower configurations, an annual sun simulation on each, and a finding that density wins across every seed.
Sun Between Towers asks how much daylight reaches the public ground between buildings - the difference between a usable park and a permanently shaded plaza. A 4x4 cell grid generator places towers from two inputs: a seed (1-20) that controls which cells get a tower and how tall each one is, and a density_sweep (0.4 / 0.6 / 0.8) that controls how many cells are occupied. Each of the 60 (seed, density) combinations runs through a Ladybug Direct Sun Hours simulation over the Oakland TMY3 weather file, producing two scores per iteration: avg sun hours on the ground plane, and the percentage of ground points above a usable-daylight threshold. How do you quantify the daylight cost of urban density on public ground space - and is layout cleverness enough to offset it?
- Iterations
- 60
- Density levels
- 3
- Sun hours, 0.4→0.8
- -38%
- Well-lit, 0.4→0.8
- -46%
The Work
Final
Approach
- 01
Parametric generator
A Grasshopper definition places towers in a 4x4 cell grid from two inputs - seed (which cells, what heights) and density_sweep (how many cells), with plot_fill fixed at 0.51.
- 02
Annual sun simulation
Ladybug Direct Sun Hours runs against the Oakland TMY3 weather file, computing per-point ground sun hours over a full year for every iteration.
- 03
60-iteration sweep
Colibri iterates all 60 (seed, density) combinations and an Aggregator writes a CSV row and a PNG image per run.
- 04
Analysis + plots
Python (pandas + matplotlib) clusters the sweep, draws the performance landscape, and renders the 60-configuration sorted grid.
From the studio
Outcome
Across all 20 sparse plans, every single one beats every single dense plan. The worst sparse layout (2271 h) still beats the best dense one (2150 h). Layout helps within a density band - it does not escape it. For a designer optimizing for public sunlight, the real question is not which arrangement to pick, but whether you can afford to build less.
Credits
- Computational Designer
- Yanik Wickremasinghe
- Course
- UC Berkeley Arch 249 - Prof. Ramon Weber
- Tooling
- Ladybug Tools, TT Toolbox / Colibri, Oakland TMY3 EPW
Next project